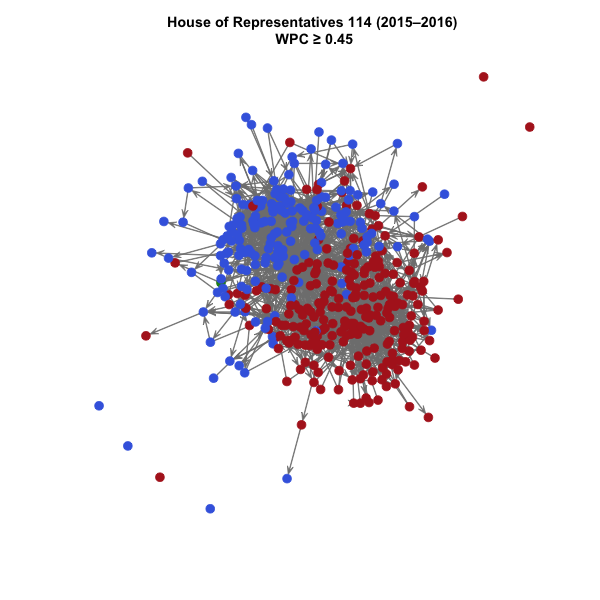
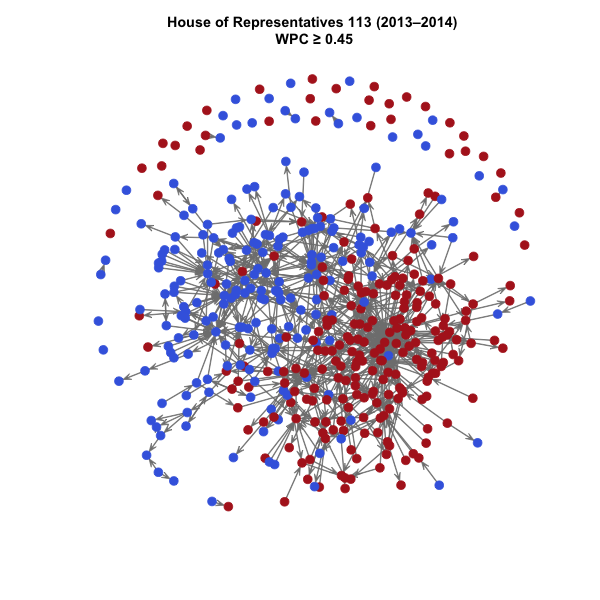
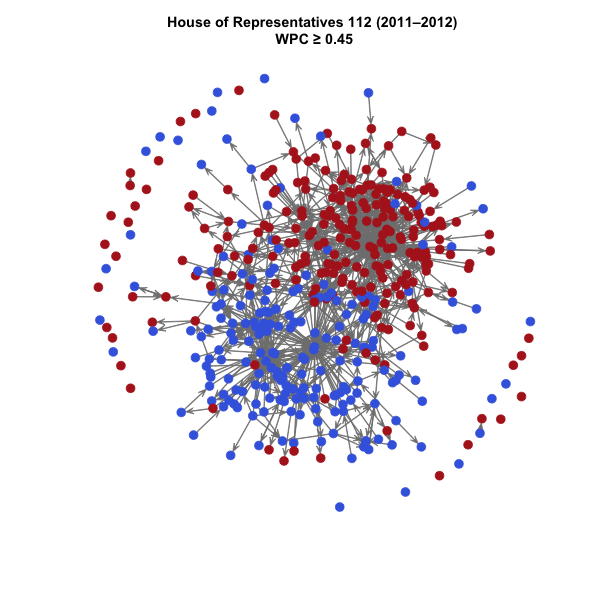
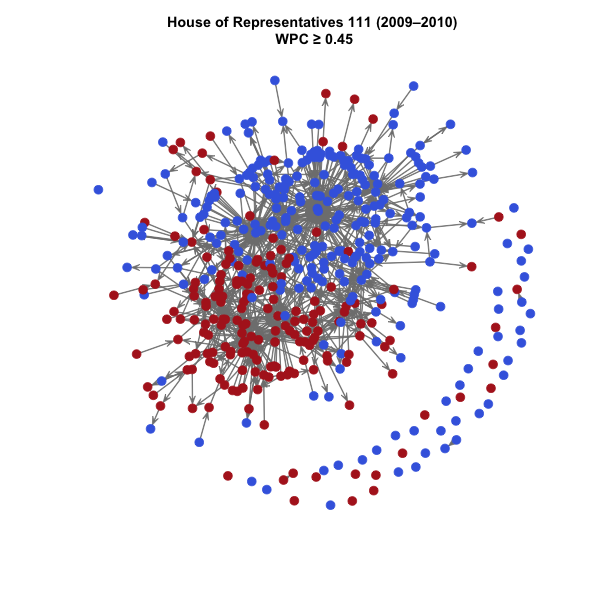
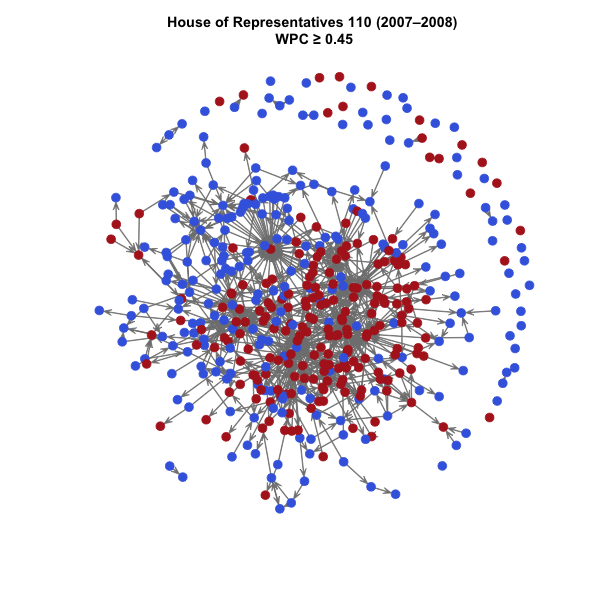
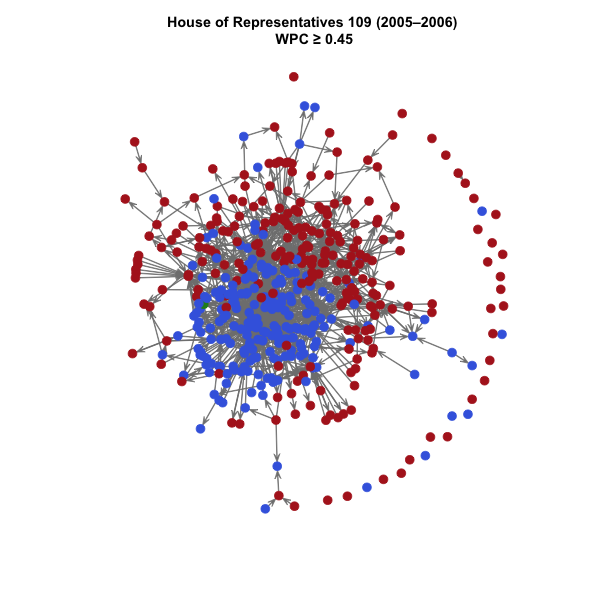
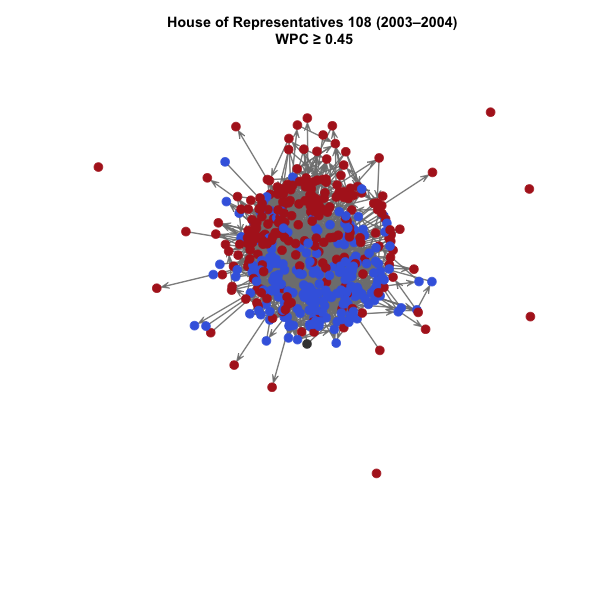
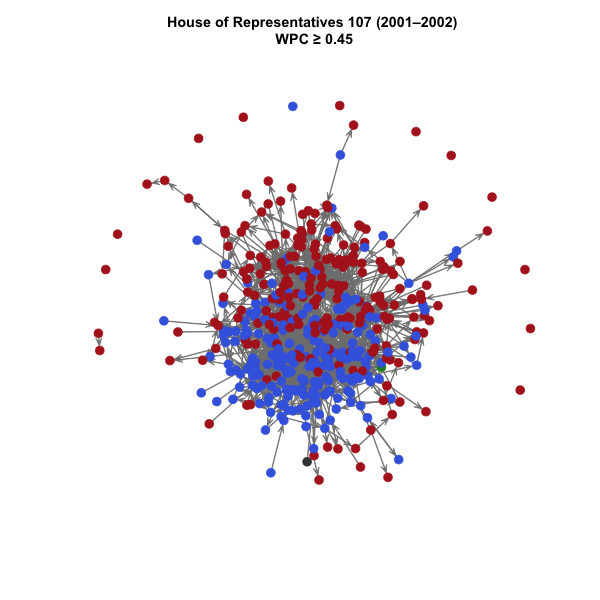
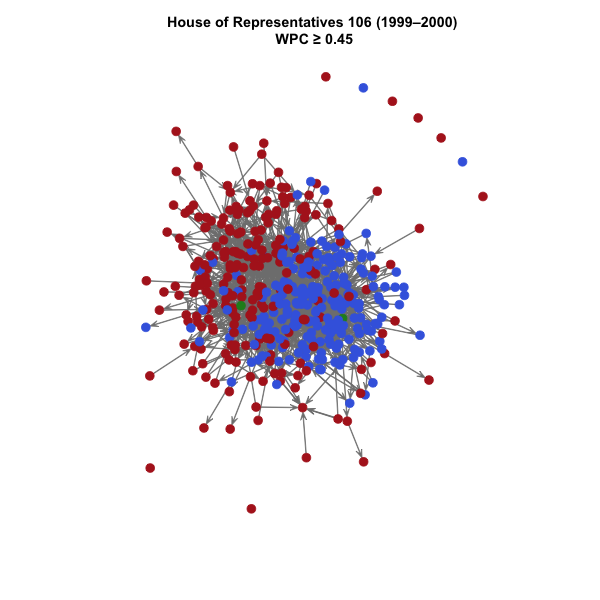
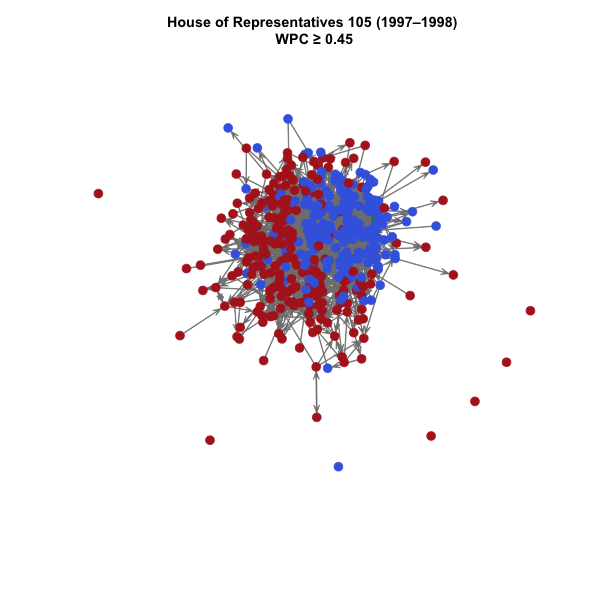
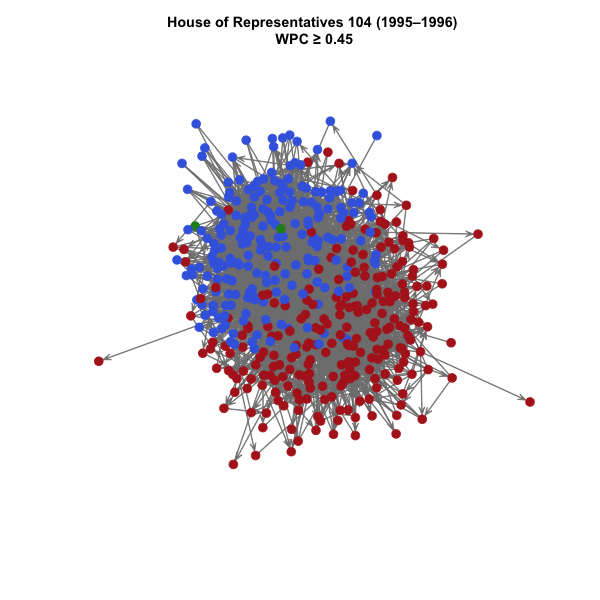
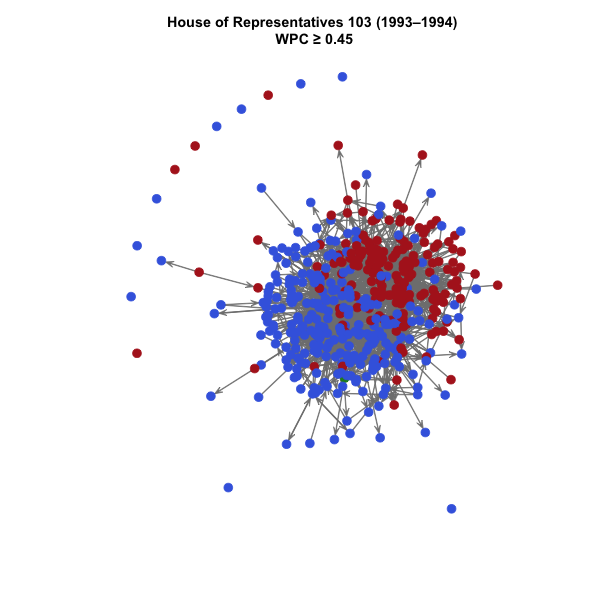
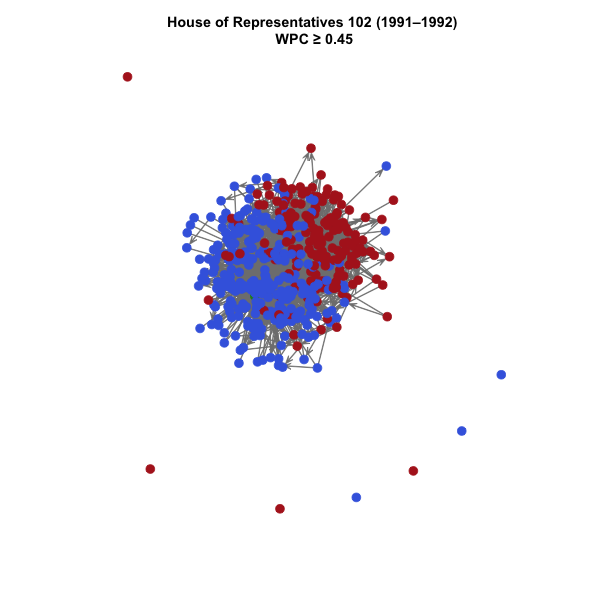
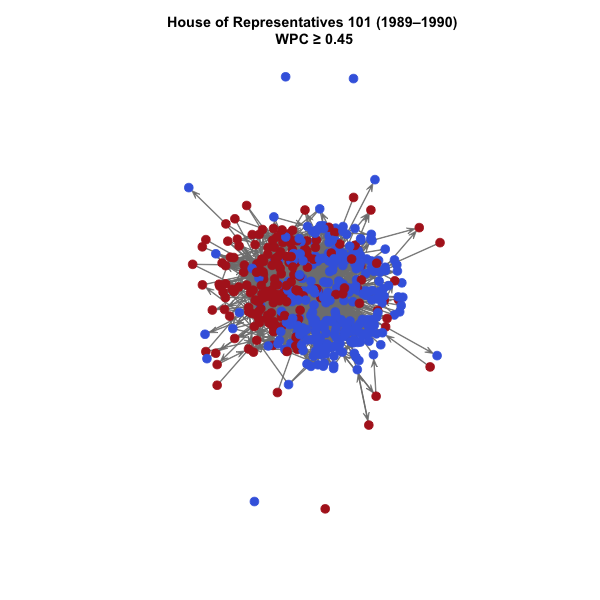
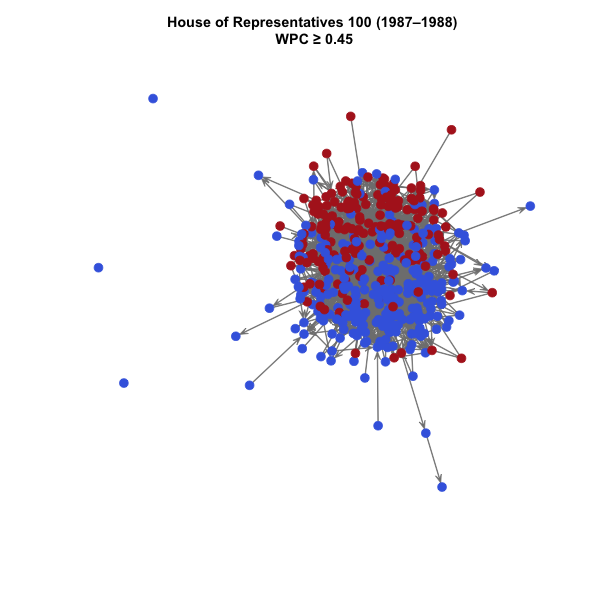
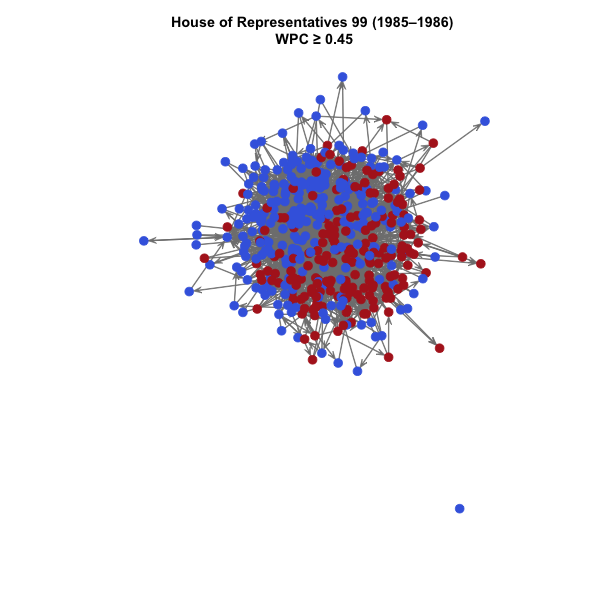
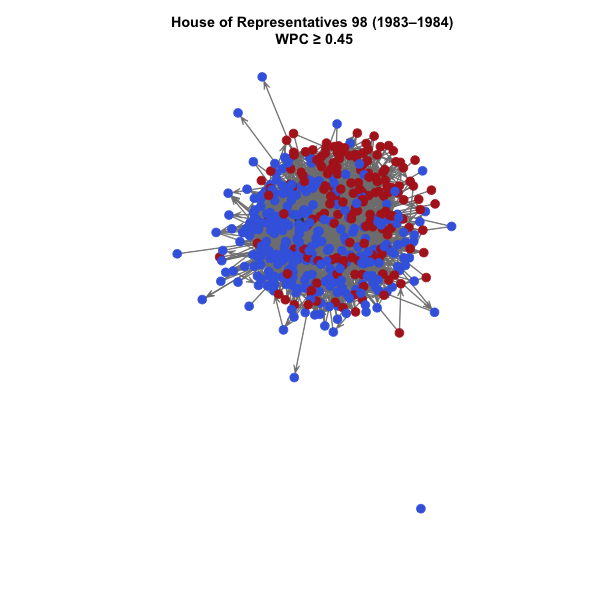
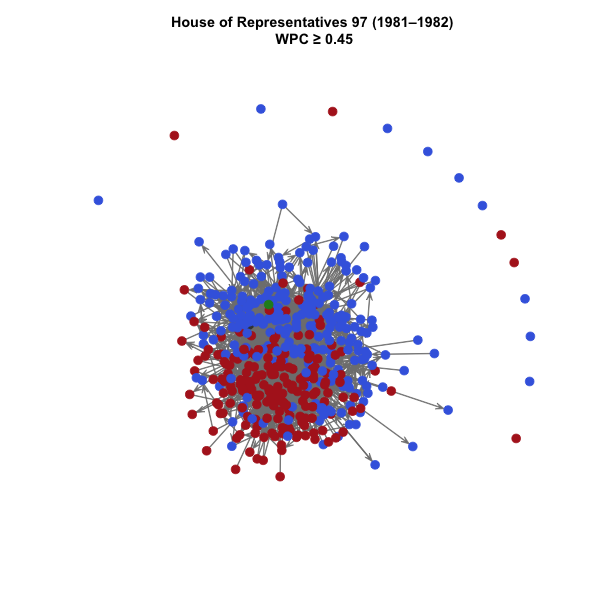
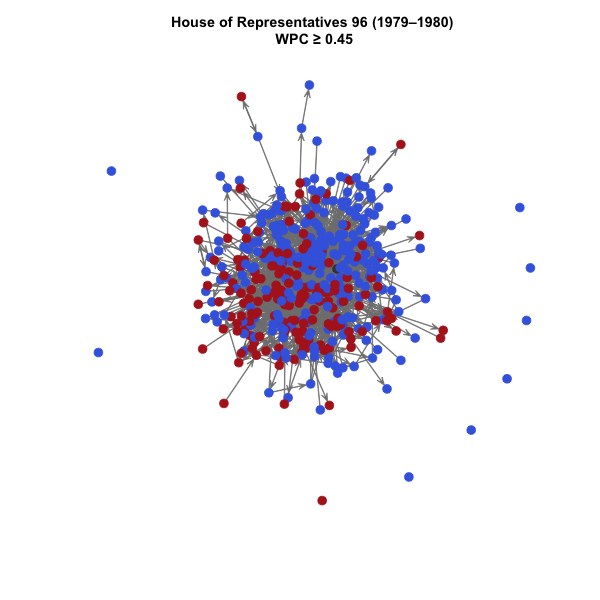
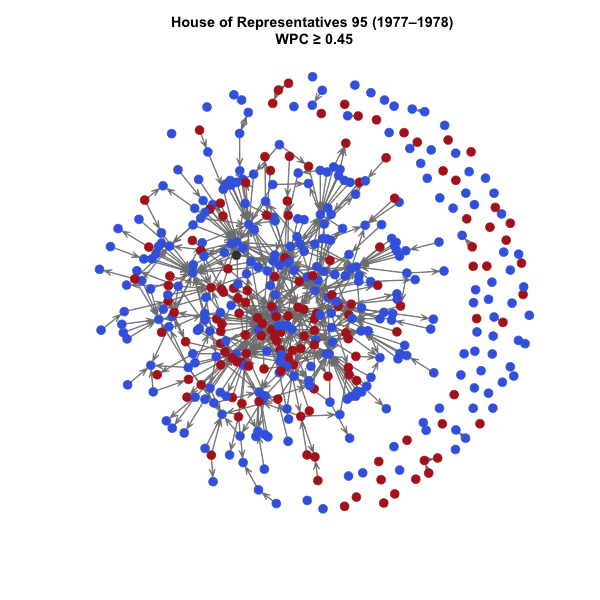
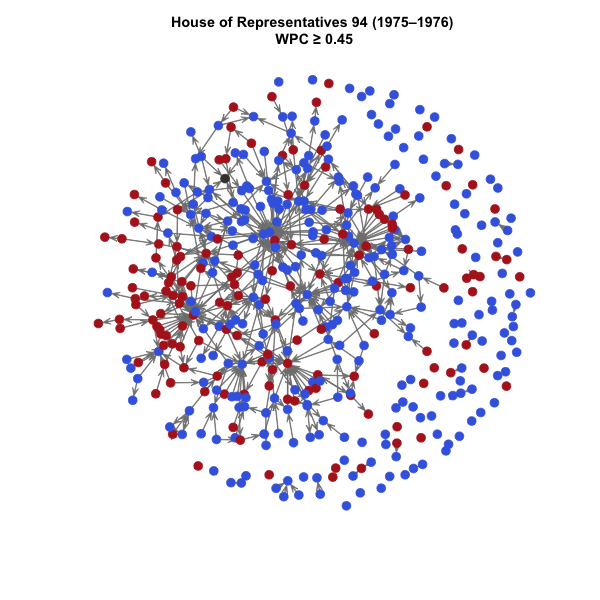
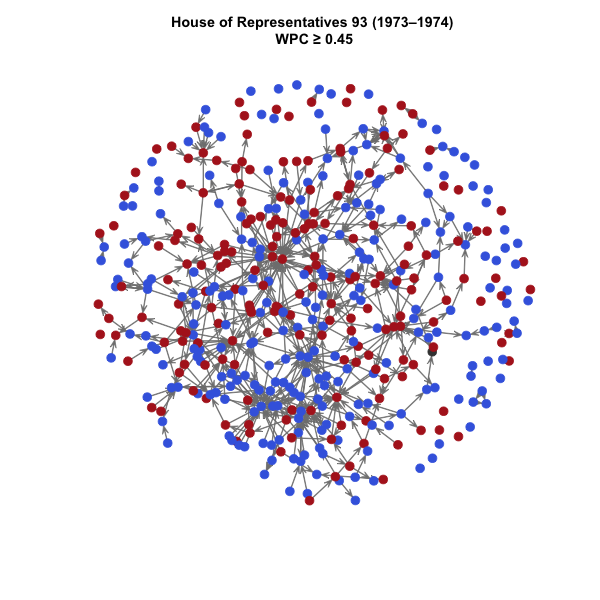
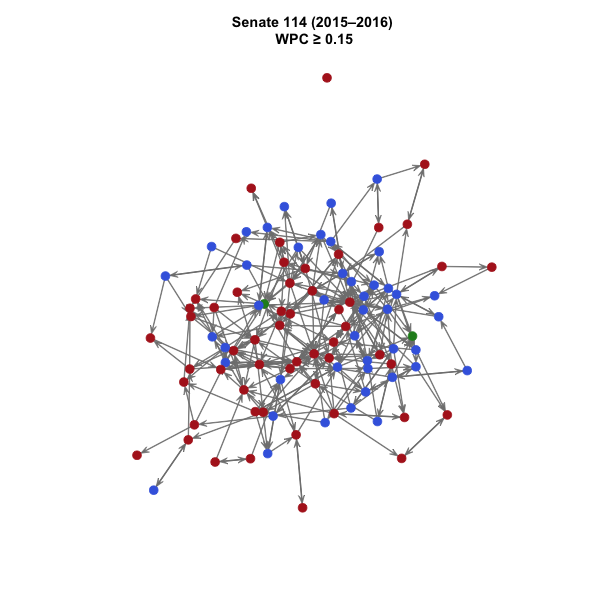
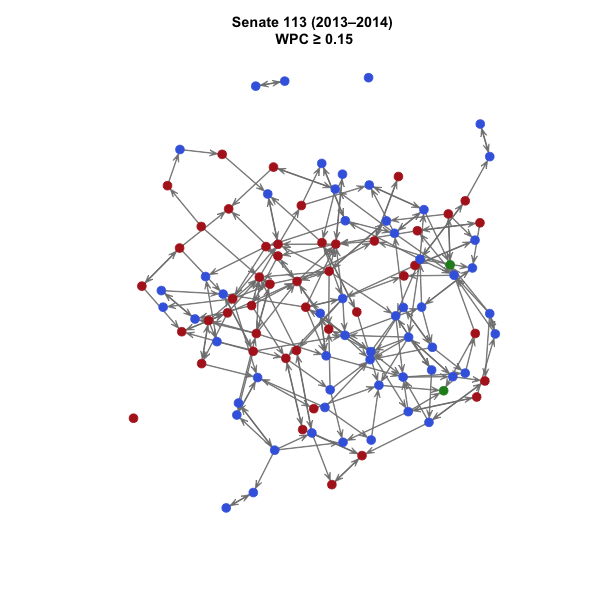
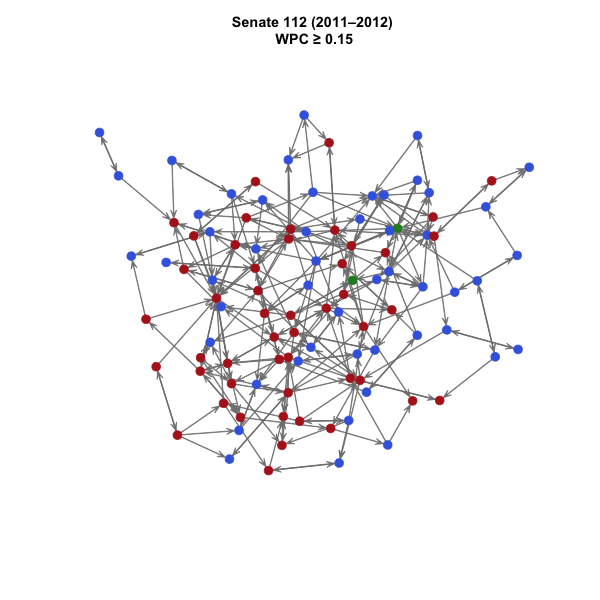
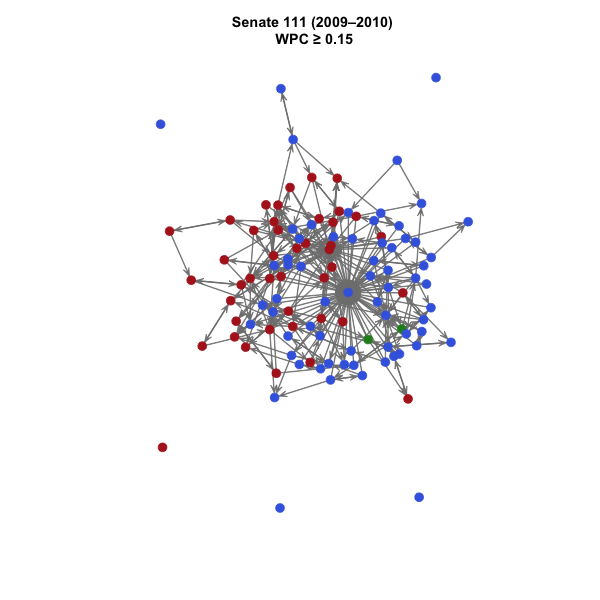
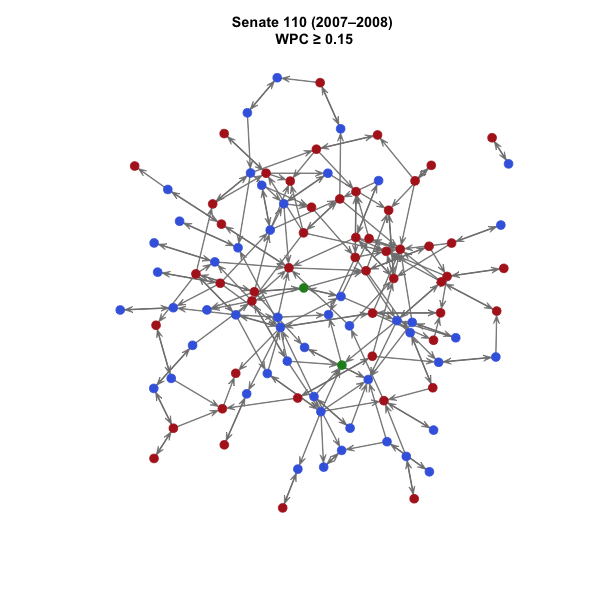
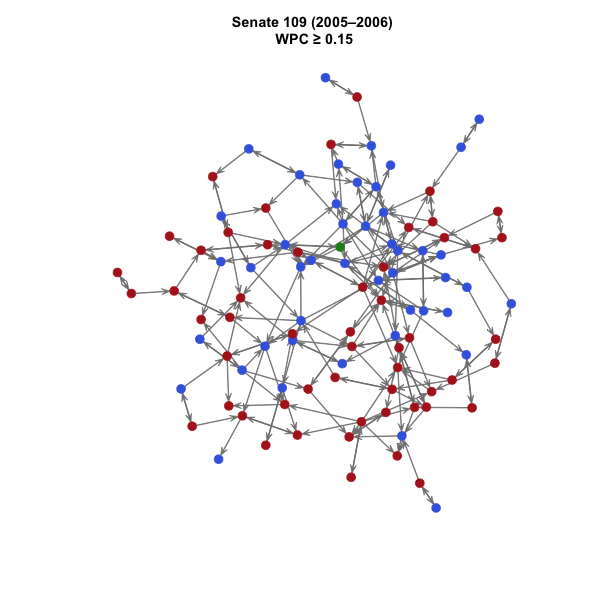
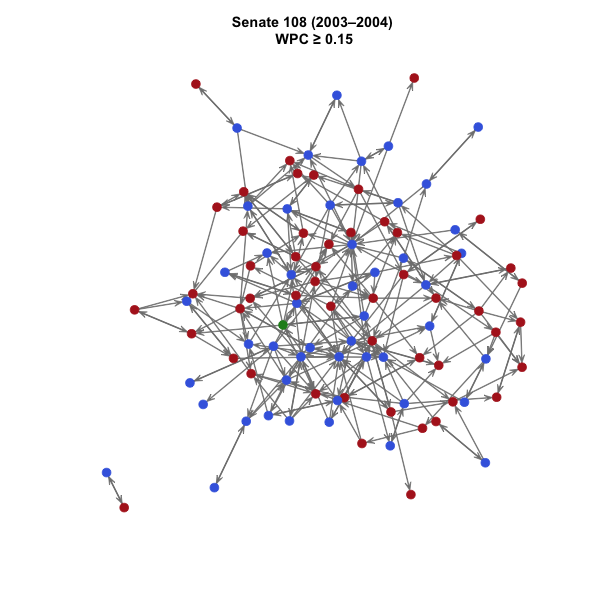
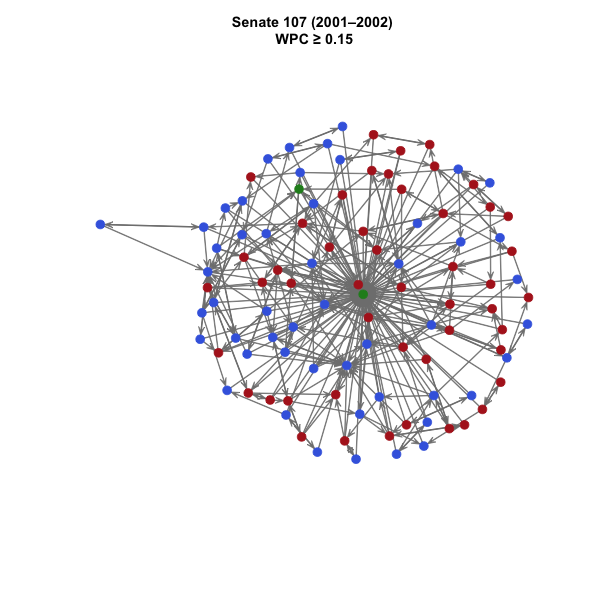
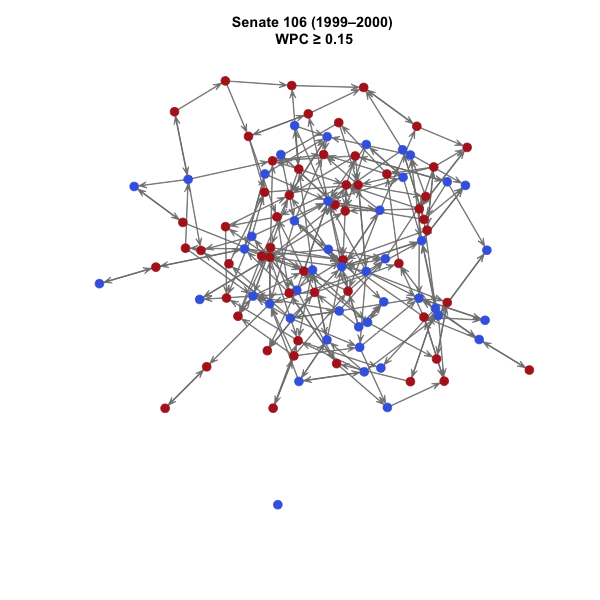
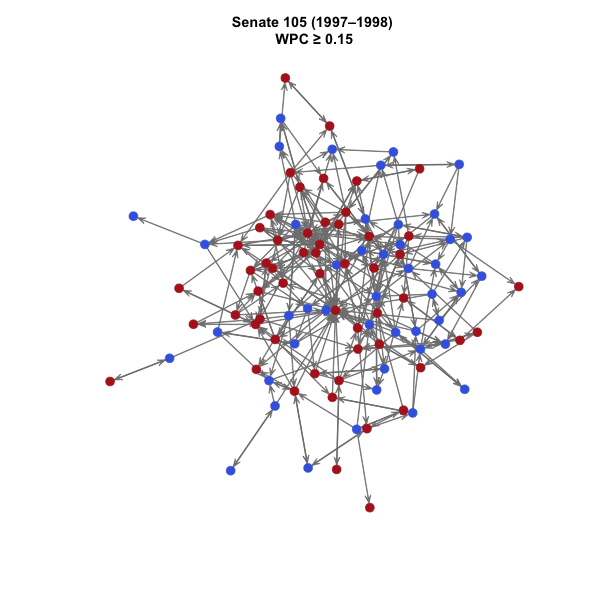
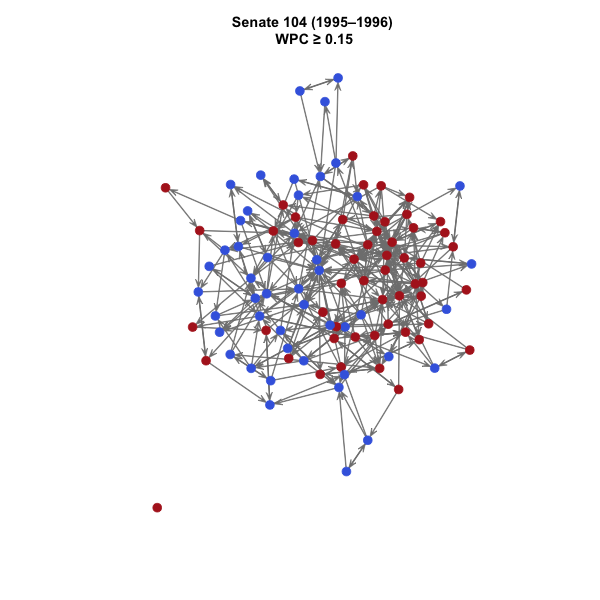
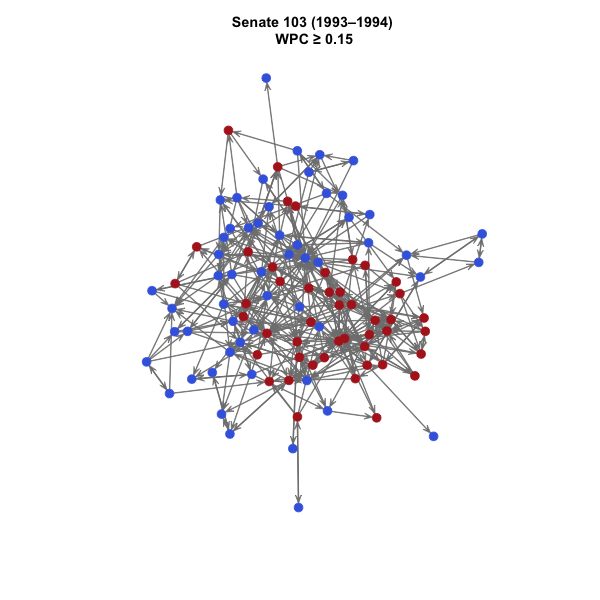
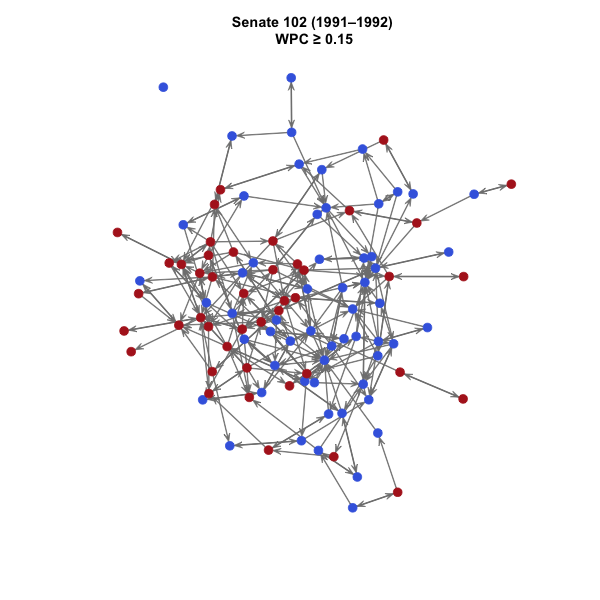
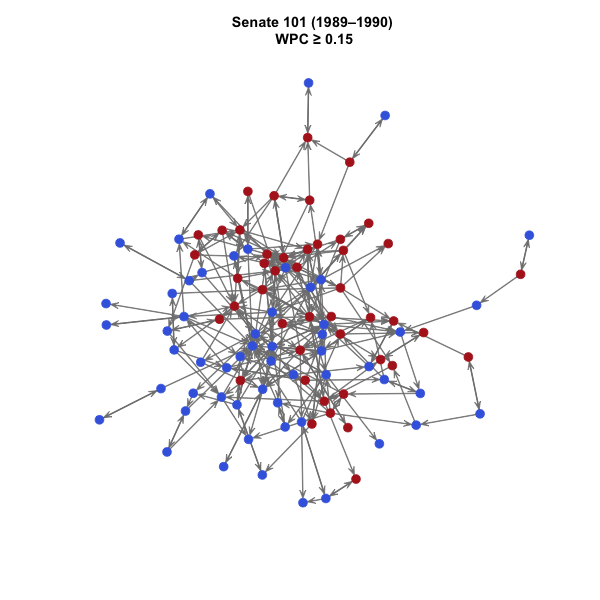
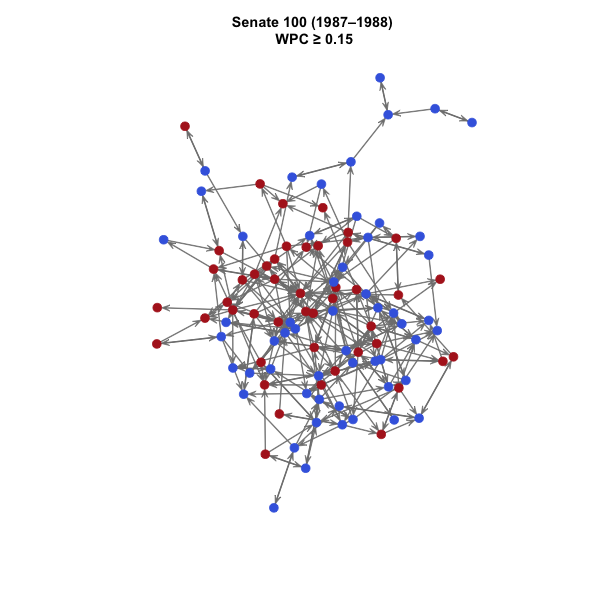
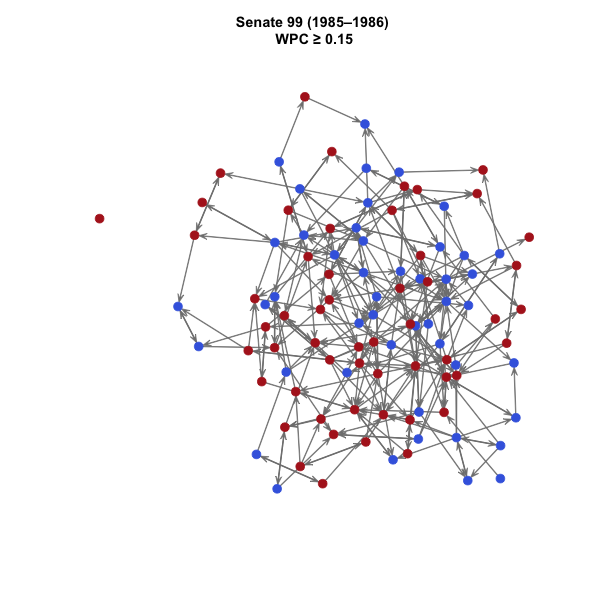
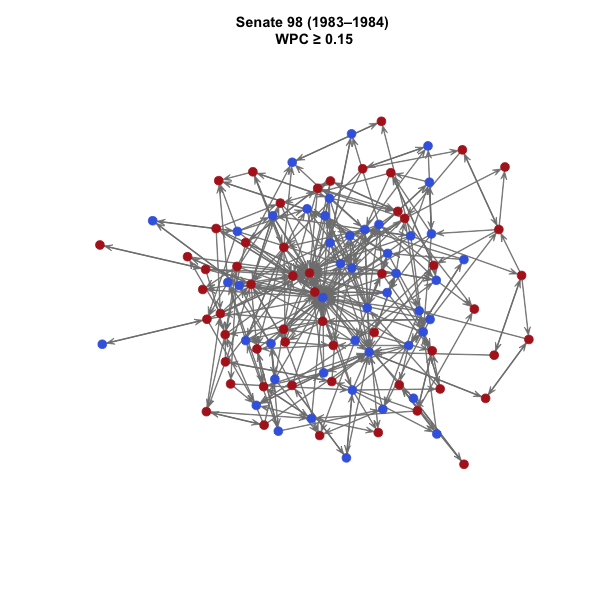
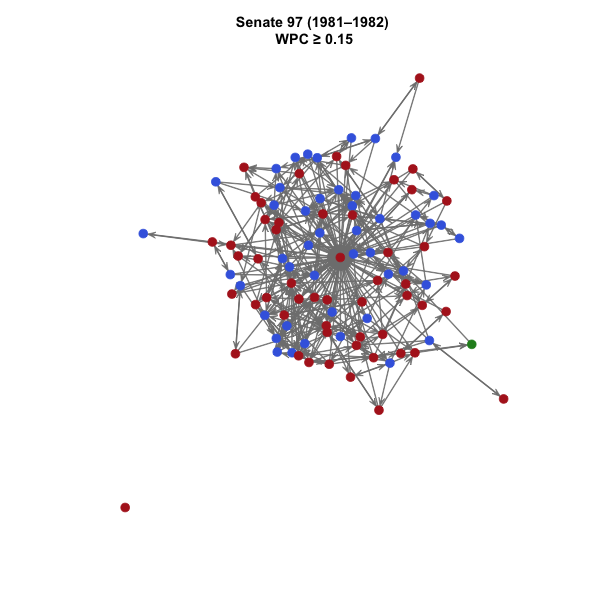
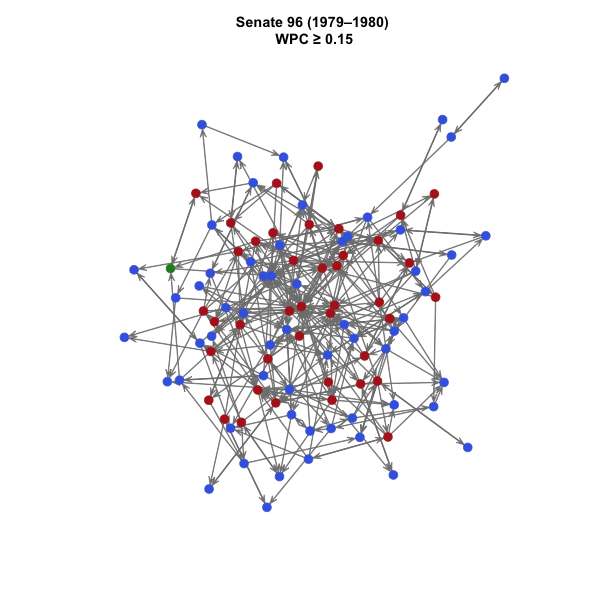
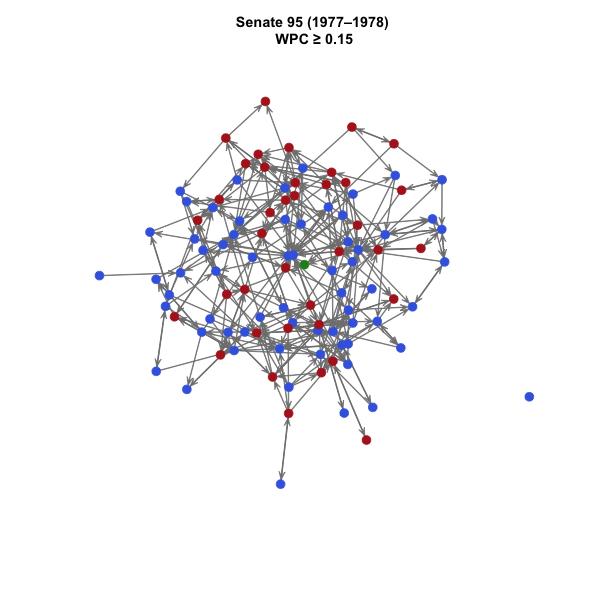
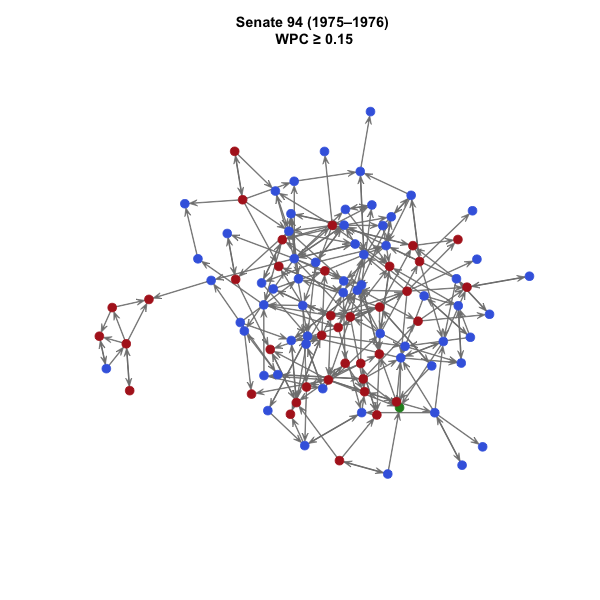
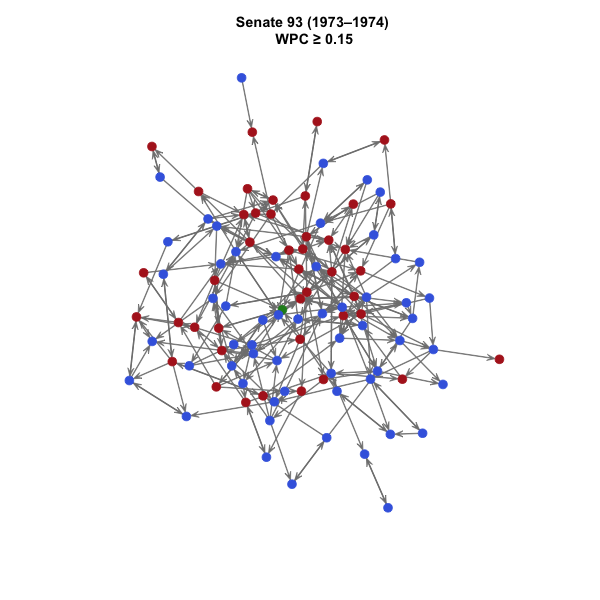
Each network shows bill cosponsorships in the U.S. Congress.
The data are split by Congressional session.
Unlike the cosponsorship network data collected by Fowler, Waugh and Sohn,
it is strictly limited to bills: amendments are not included.
All networks are directed graphs drawn with the Fruchterman-Reingold force-directed algorithm.
The ties connect the sponsor of each bill to the cosponsors of that bill.
Democrats are shown in blue, Republicans in red, independents in green and others in grey.
The graphs are subset to their most important ties by using the weighted propensity to cosponsor (WPC) scheme by Gross, Kirkland and Shalizi.
Graphs for the House of Representatives show only ties at WPC ≥ 0.45, and graphs for the Senate show only ties at WPC ≥ 0.15.
Similar graphs are available for other countries.
House of Representatives
C. 114 (2015—)
 C. 113 (2013—2014)
 C. 112 (2011—2012)
 C. 111 (2009—2010)
 C. 110 (2007—2008)
 C. 109 (2005—2006)
 C. 108 (2003—2004)
 C. 107 (2001—2002)
 C. 106 (1999—2000)
 C. 105 (1997—1998)
 C. 104 (1995—1996)
 C. 103 (1993—1994)
 C. 102 (1991—1992)
 C. 101 (1989—1990)
 C. 100 (1987—1988)
 C. 99 (1985—1986)
 C. 98 (1983—1984)
 C. 97 (1981—1982)
 C. 96 (1979—1980)
 C. 95 (1977—1978)
 C. 94 (1975—1976)
 C. 93 (1973—1974)
Senate
C. 114 (2015—)
 C. 113 (2013—2014)
 C. 112 (2011—2012)
 C. 111 (2009—2010)
 C. 110 (2007—2008)
 C. 109 (2005—2006)
 C. 108 (2003—2004)
 C. 107 (2001—2002)
 C. 106 (1999—2000)
 C. 105 (1997—1998)
 C. 104 (1995—1996)
 C. 103 (1993—1994)
 C. 102 (1991—1992)
 C. 101 (1989—1990)
 C. 100 (1987—1988)
 C. 99 (1985—1986)
 C. 98 (1983—1984)
 C. 97 (1981—1982)
 C. 96 (1979—1980)
 C. 95 (1977—1978)
 C. 94 (1975—1976)
 C. 93 (1973—1974)

