sfReapportion
This note documents the release of the sfReapportion package, which performs areal-weighted interpolation on spatial objects such as census tracts and voting districts.
A colleague of mine recently shared some code for a research project on the upcoming municipal elections in France, but the code required the spReapportion package, which has been hard to install and use for a few years, due to some of its dependencies, maptools and rgeos, having been retired in favour of the sf package.
The spReapportion package, which performs areal-weighted interpolation, was coded by a friend of mine. I decided to port his package in order for it to lose its retired dependencies, and to have it accept sf objects as well as sp ones. The result is available on CRAN and on GitHub as the sfReapportion package.
In parallel, I rewrote my other colleague's code in order to use that new package and to perform several other improvements. The first set of maps shown below come from early results obtained with that code, which is also on GitHub.
Rationale
In France as in many if not most other countries, the census tracts, which are called IRIS, are spatially incongruous with voting districts. If one wants to use data collected at the tract-level with voting data collected at the district-level, then one first has to interpolate/reapportion that data to the spatial boundaries of voting districts.
The two maps below show the polling stations (or bureaux de vote, in French) of the city of Lille, the boundaries of which have been stable for several years. Each map shows the results of a distinct principal components analysis, followed by a hierarchal clustering of its principal components.
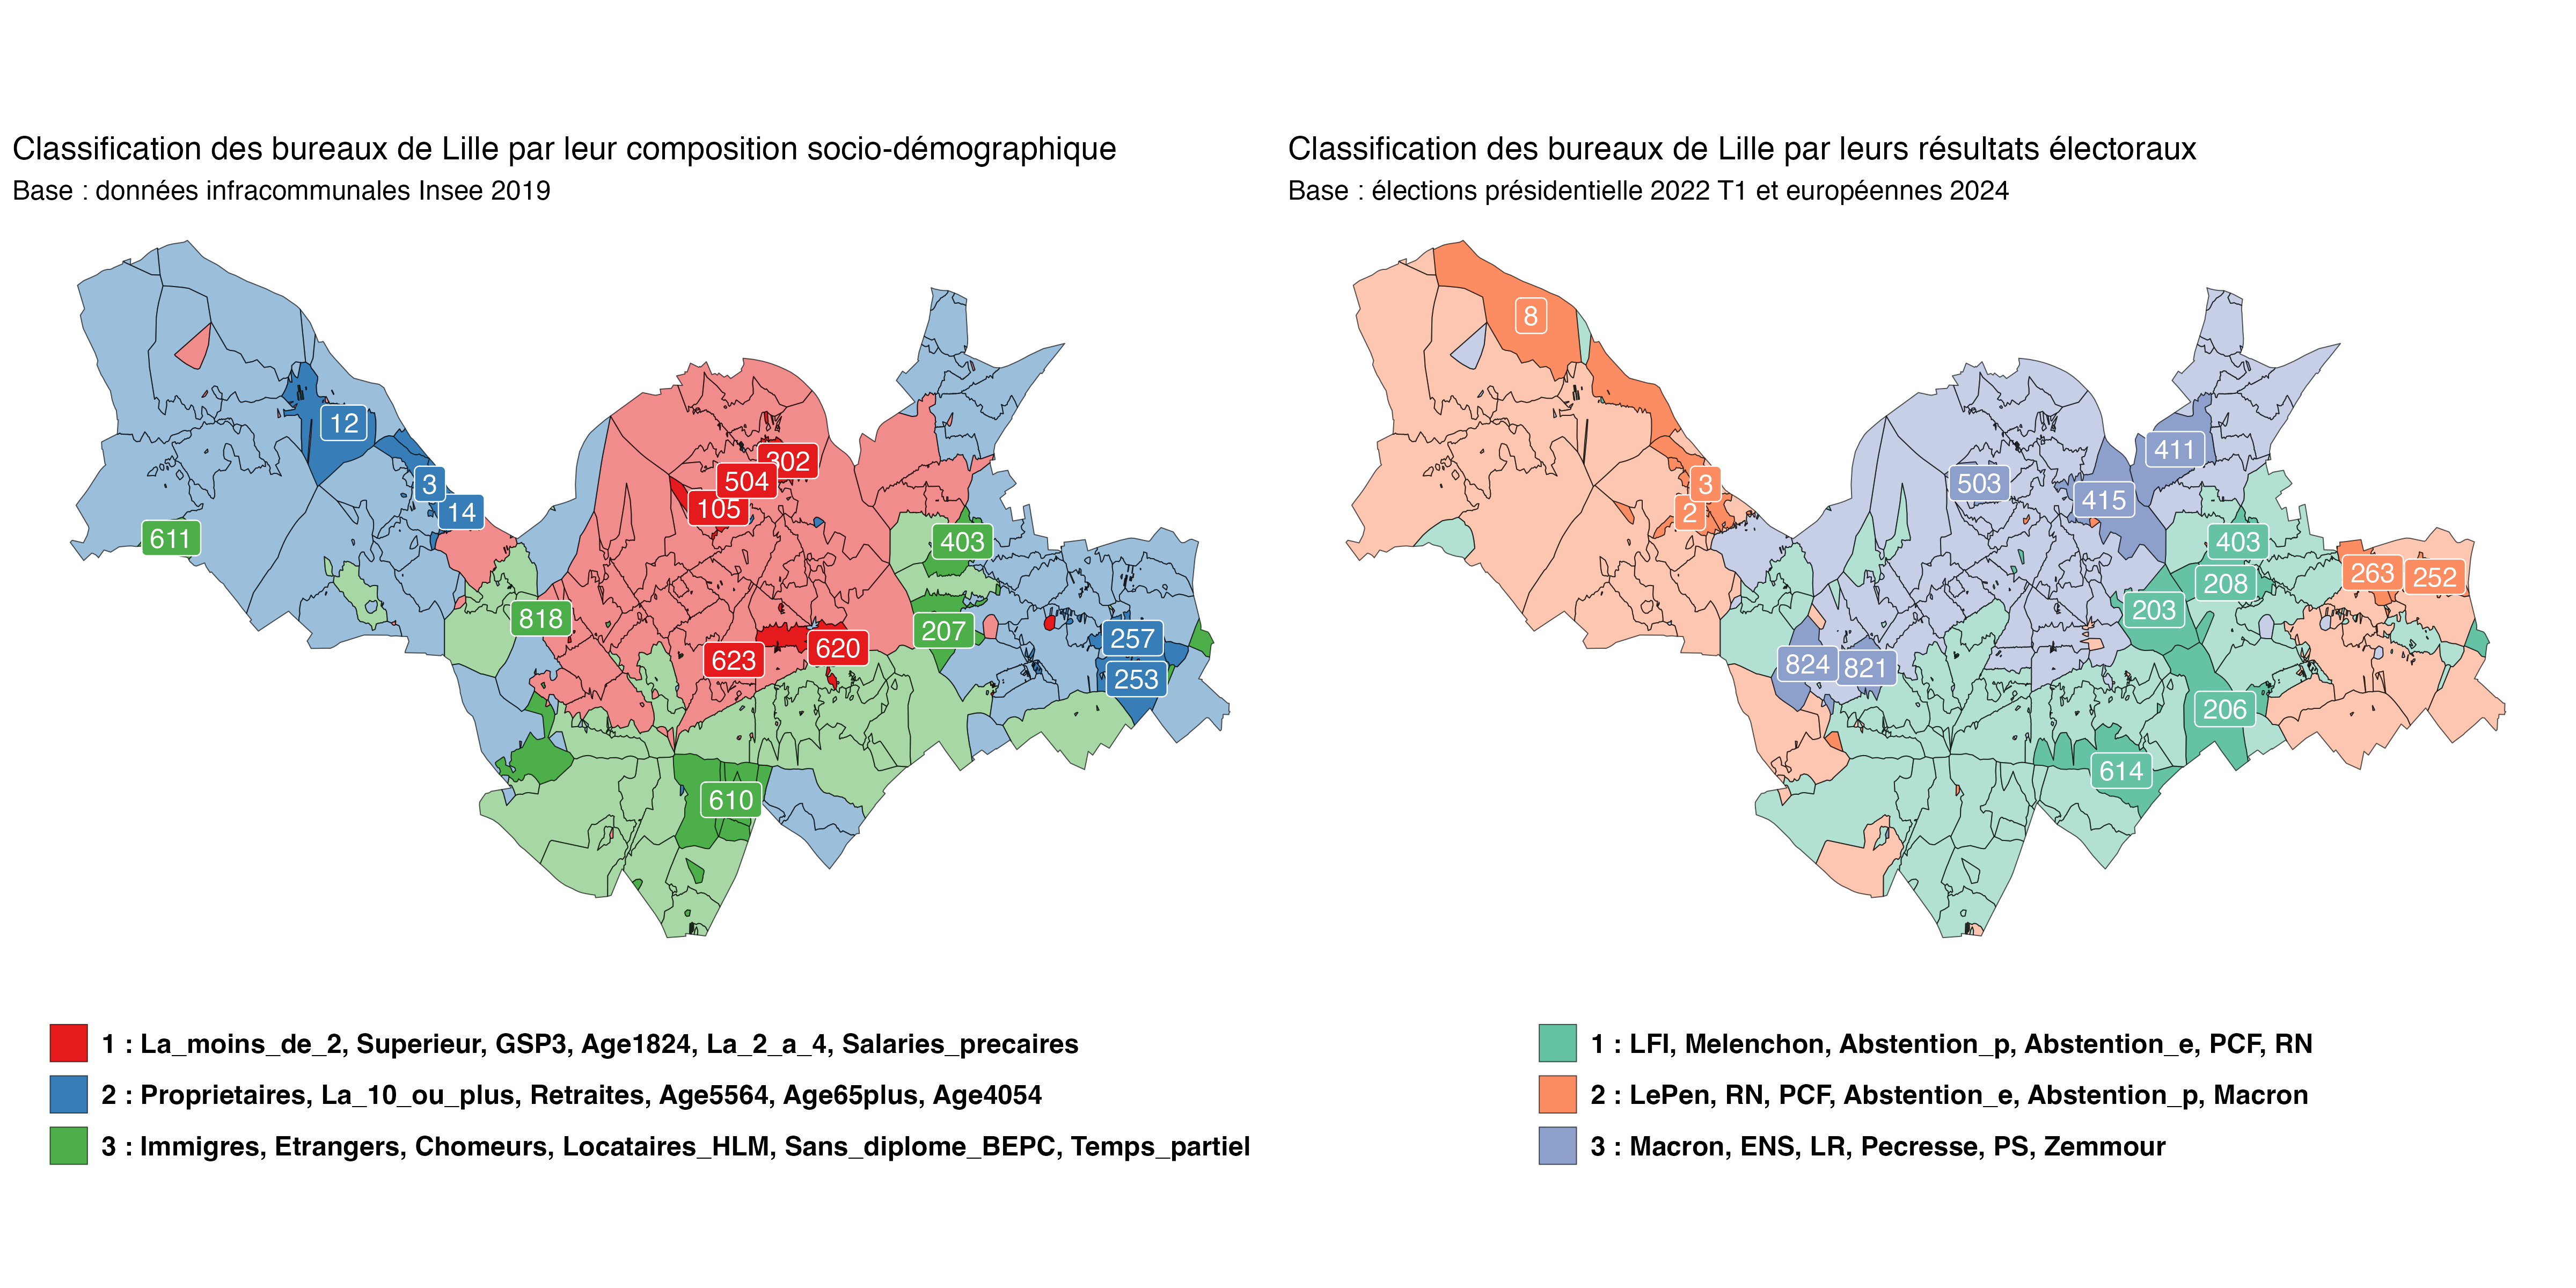
The map on the left is the interesting one. The data used for the underlying principal components analysis come from the French official statistics agency, Insee, which publishes that data at the tract-level. The data were reapportioned with sfReapportion in order to coincide with the boundaries of the voting districts.
Features
The spReapportion package can reapportion three kinds of data:
- counts, e.g. number of working-age adults in a given geographic area
- proportions, e.g. percentage of pensioners in a given geographic area
- weighted points, e.g. number of residents at a given set of coordinates
The latter case is the most complex one to illustrate. The two maps below show the 20th arrondissement of Paris. The map on the left shows the spatial incongruity between its polling stations and its census tracts, whereas the map on the right also shows where the voters of that arrondissement live, according to the Répertoire électoral unique (REU).
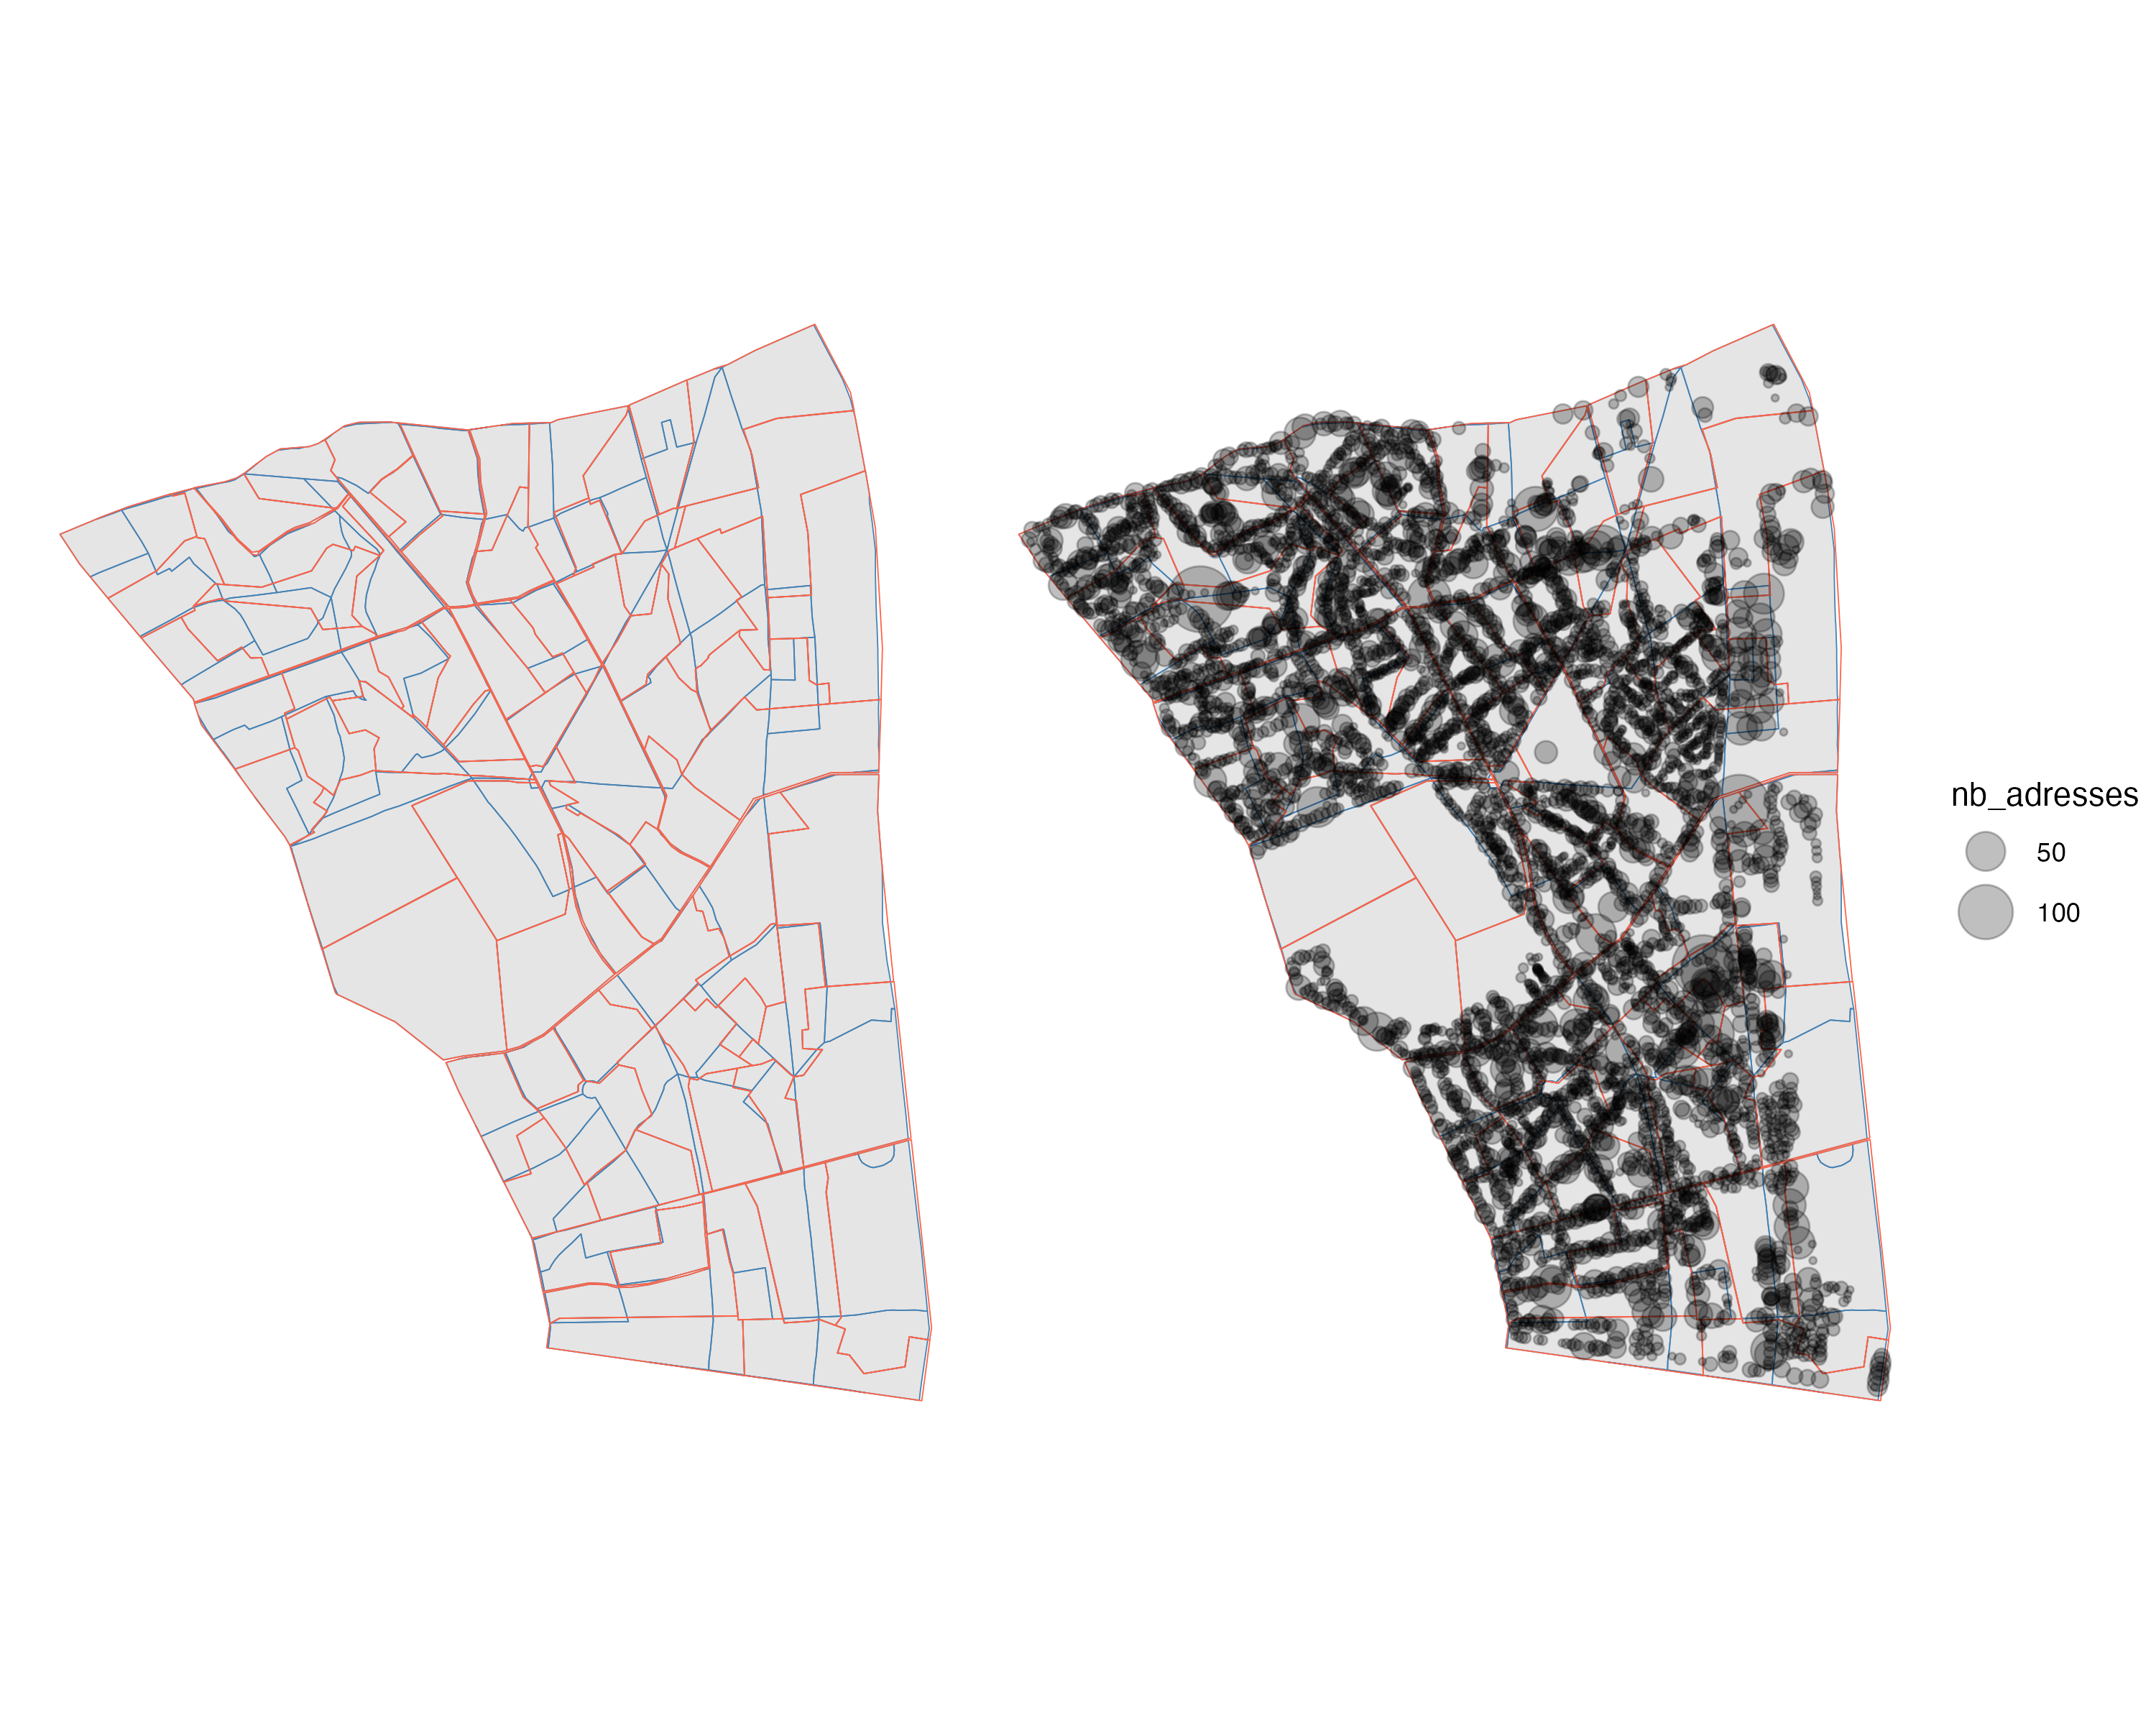
When interpolating from one (spatial) geometry to another, we want to take that information into account, in order to reapportion the data to the areas where actual observations are to be found. The results are starkly different once that correction is taken into account:
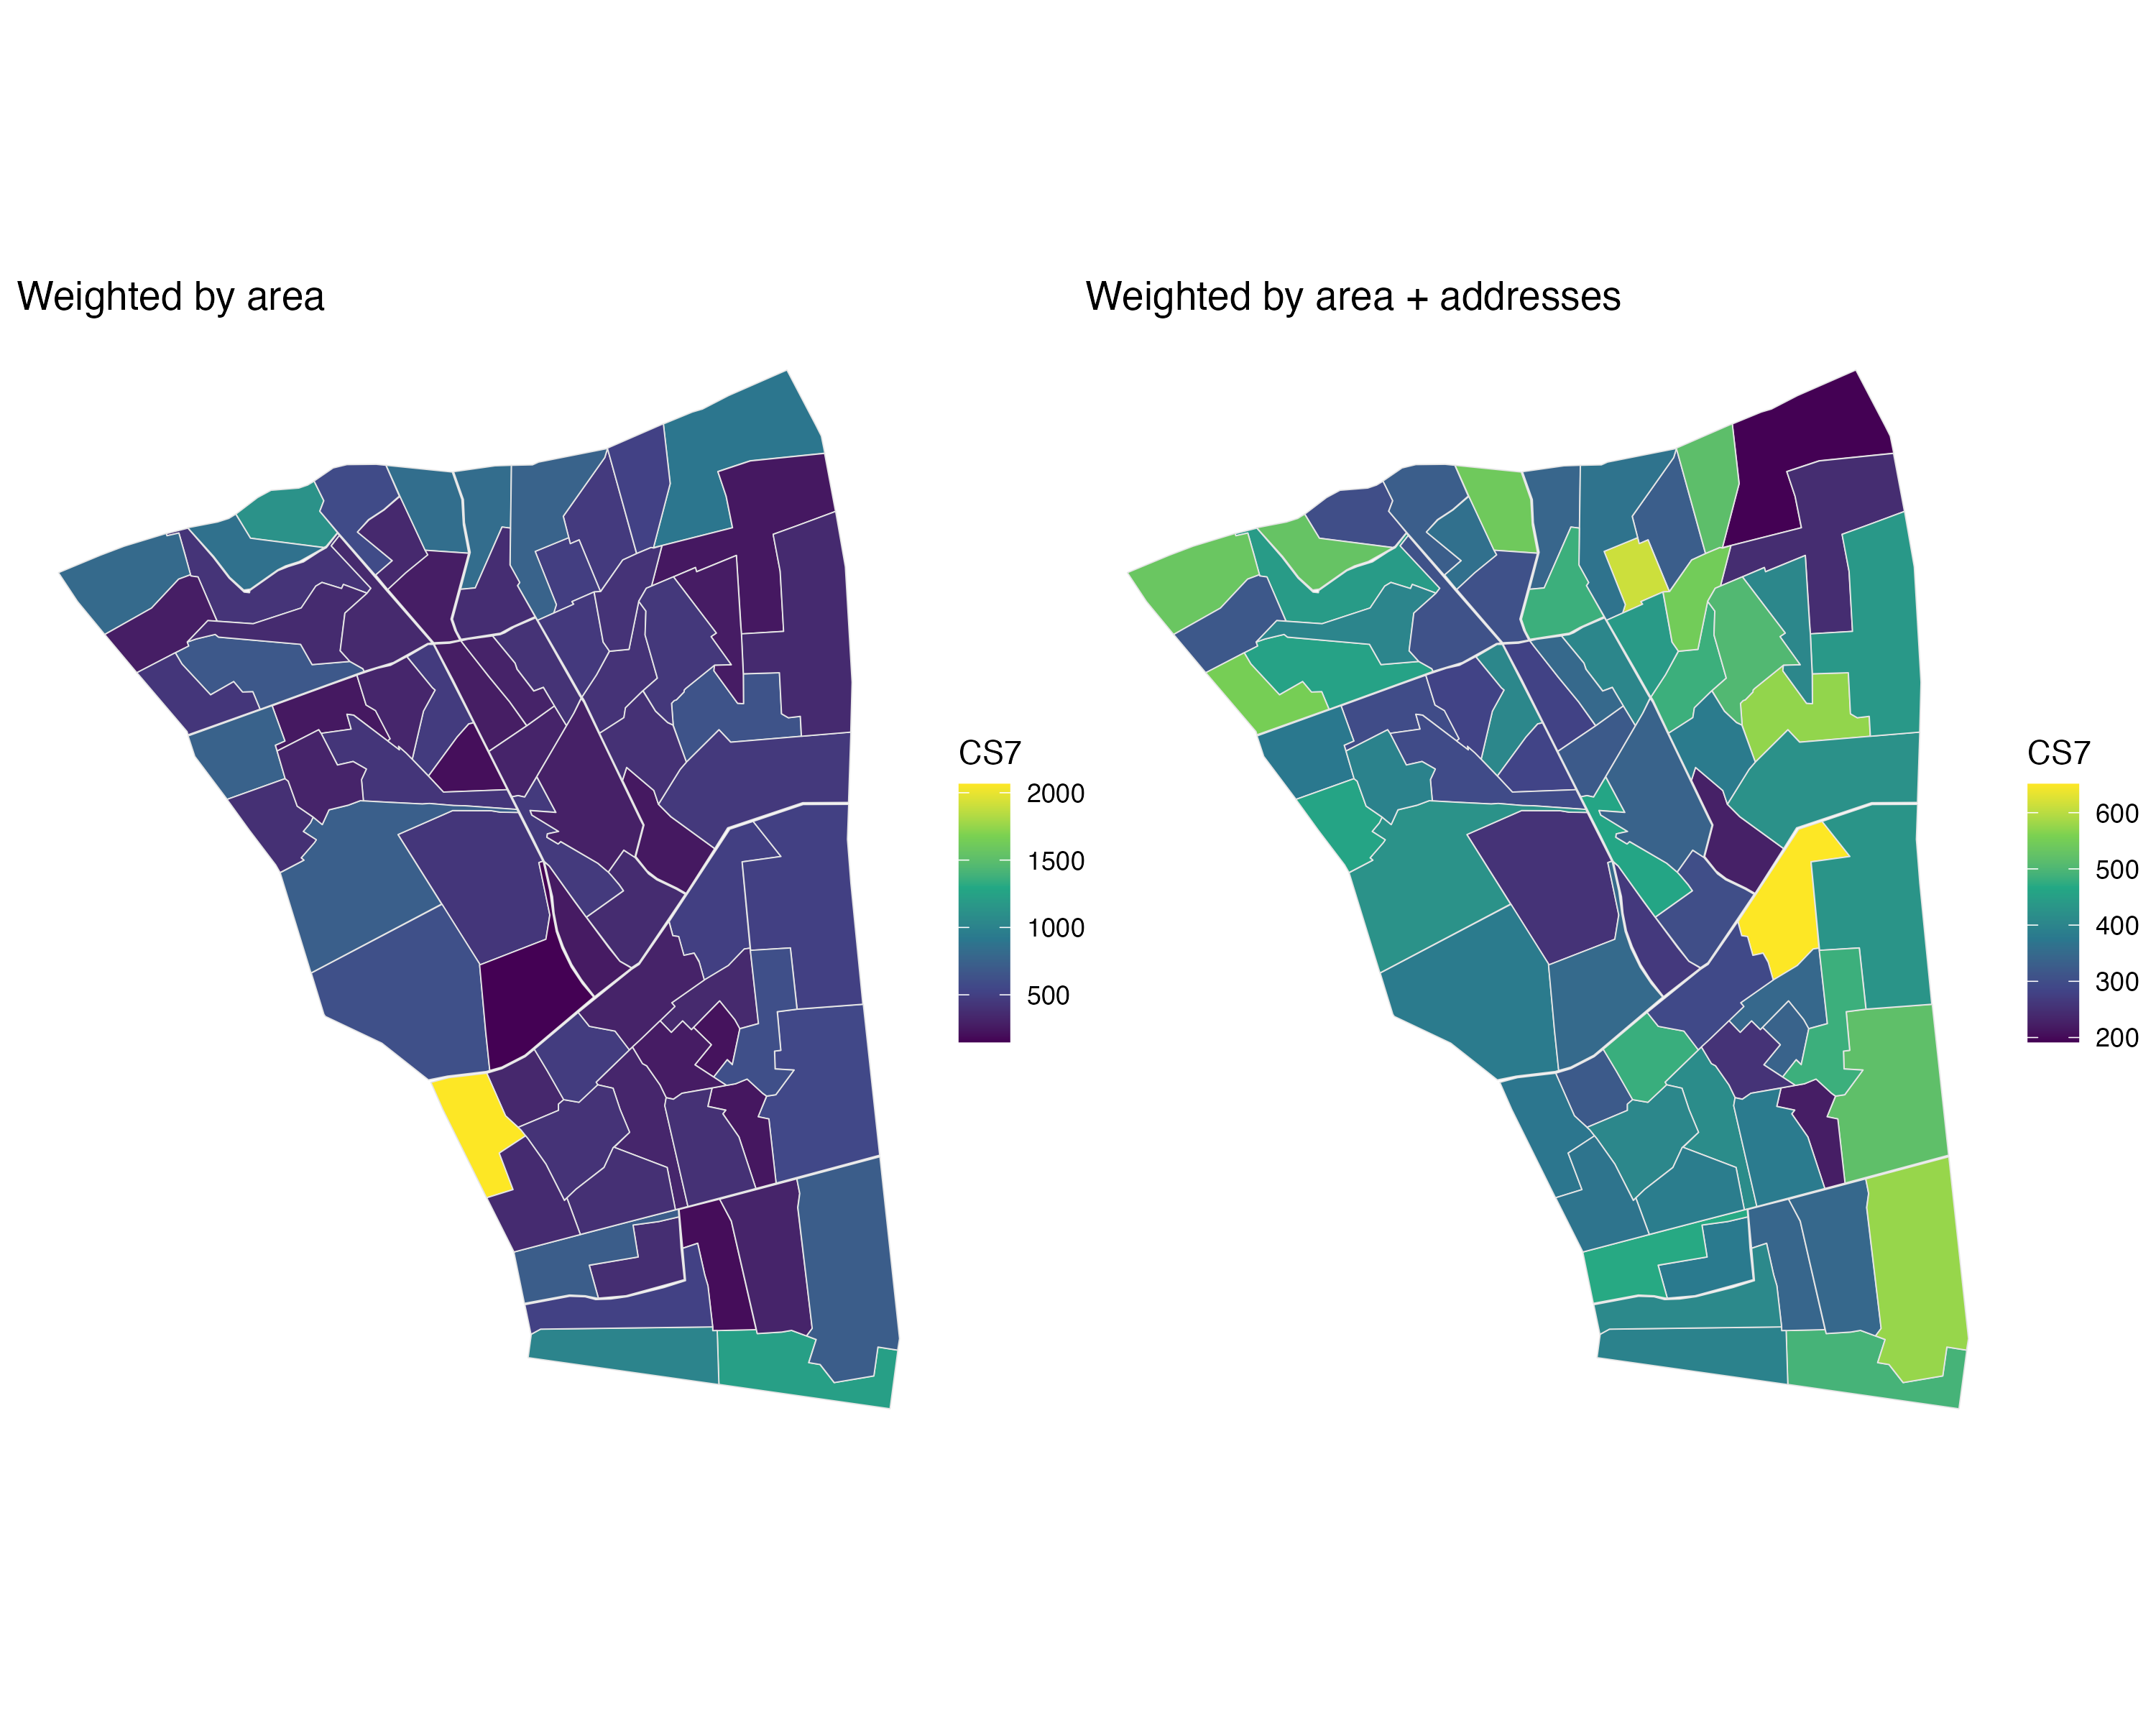
The example above is based on approximate data, as we are looking at voter addresses, rather than at the exact number of voters at a given address, but the corrective effect is still notable and possibly sufficient for our purposes.
Limitations
The sfReapportion package has only been lightly tested when it comes to its weighted modes. However, the main function, which uses unweighted population counts by default, has been thoroughly tested, and its results have been successfully reproduced with the areal package.
The sfReapportion package only performs extensive areal-weighted interpolation: for intensive or multiple (mixed) interpolation, users should turn to the areal package. Additional methods are also available from the populR package.
I do not plan to update the sfReapportion package much, as it was coded for reproducibility purposes, but users might open issues on its GitHub repository in order to ask questions or suggest improvements.
Update (March 28, 2026): version 0.2.0 of the package has been submitted to CRAN and should become available there soon. This post has been updated to document some of the new features. The code used to produce the last two plots is available from this Gist, which expands on the code provided in the README file of the package.
- First published on December 26th, 2025